import pandas as pd
import numpy as np
import matplotlib.pyplot as plt
from pathlib import PathLinear Regression
Predicted value is continuous
path = Path('Data/homeprices.csv')
df = pd.read_csv(path)
df| area | bedrooms | age | price | |
|---|---|---|---|---|
| 0 | 2600 | 3.0 | 20 | 550000 |
| 1 | 3000 | 4.0 | 15 | 565000 |
| 2 | 3200 | NaN | 18 | 610000 |
| 3 | 3600 | 3.0 | 30 | 595000 |
| 4 | 4000 | 5.0 | 8 | 760000 |
| 5 | 4100 | 6.0 | 8 | 810000 |
plt.xlabel('area')
plt.ylabel('price')
plt.scatter(df.area,df.price,color='red',marker='+')

plt.show()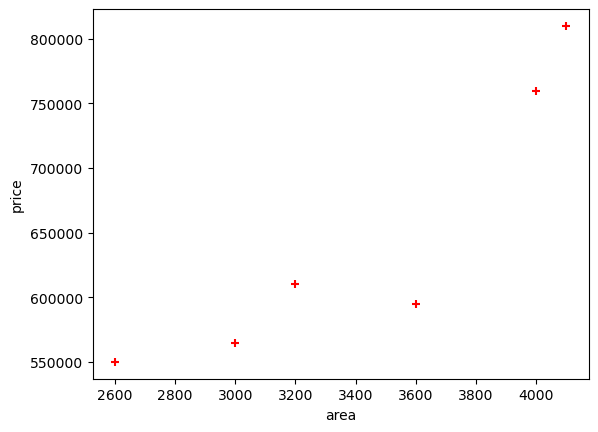
new_df = df.drop('price',axis='columns')
new_df = new_df.drop('bedrooms',axis='columns')
new_df = new_df.drop('age',axis='columns')
new_df| area | |
|---|---|
| 0 | 2600 |
| 1 | 3000 |
| 2 | 3200 |
| 3 | 3600 |
| 4 | 4000 |
| 5 | 4100 |
price = df.price
price
0 550000
1 565000
2 610000
3 595000
4 760000
5 810000
Name: price, dtype: int64from sklearn import linear_model# Create linear regression object
reg = linear_model.LinearRegression()
reg.fit(new_df,price)LinearRegression()In a Jupyter environment, please rerun this cell to show the HTML representation or trust the notebook.
On GitHub, the HTML representation is unable to render, please try loading this page with nbviewer.org.
LinearRegression()
reg.predict([[3300]])/home/ben/mambaforge/envs/cfast/lib/python3.11/site-packages/sklearn/base.py:464: UserWarning: X does not have valid feature names, but LinearRegression was fitted with feature names
warnings.warn(array([628813.88621022])reg.coef_array([167.30954677])reg.intercept_76692.3818707813Y = m * X + b (m is coefficient and b is intercept)
5000*reg.coef_ + reg.intercept_array([913240.11571842])reg.predict([[5000]])/home/ben/mambaforge/envs/cfast/lib/python3.11/site-packages/sklearn/base.py:464: UserWarning: X does not have valid feature names, but LinearRegression was fitted with feature names
warnings.warn(array([913240.11571842])Generate CSV file with list of home price predictions
Create a list of numbers from 1000 to 5000 with 500 increments
numbers_list = list(range(2000, 4000, 500))# Create a DataFrame using the pandas constructor and a dictionary
data = {'area': numbers_list}
area_df = pd.DataFrame(data)
area_df| area | |
|---|---|
| 0 | 2000 |
| 1 | 2500 |
| 2 | 3000 |
| 3 | 3500 |
p = reg.predict(area_df)
p
array([411311.47540984, 494966.2487946 , 578621.02217936, 662275.79556413])area_df['prices']=p
area_df| area | prices | |
|---|---|---|
| 0 | 2000 | 411311.475410 |
| 1 | 2500 | 494966.248795 |
| 2 | 3000 | 578621.022179 |
| 3 | 3500 | 662275.795564 |
plt.xlabel('area')
plt.ylabel('price')
plt.scatter(df.area,
            df.price,
            color='red',
            marker='+')

plt.scatter(area_df.area,
            area_df.prices,
            color='green',
            marker='o')

plt.show()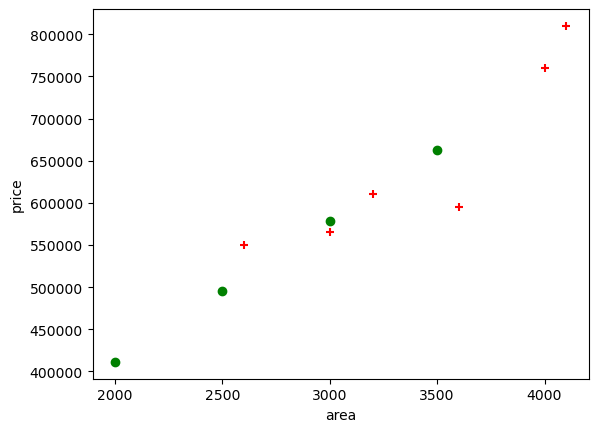
area_df.to_csv("./Data/prediction.csv")